
4D v13
Types of 3D graphs
 Types of 3D graphs
This section describes each three-dimensional graph type. The following diagram shows a three-dimensional (three-axis) graph:
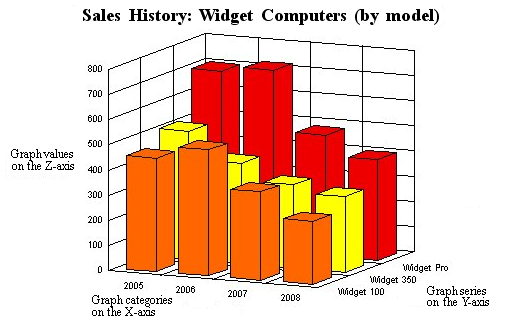
As with a two-dimensional graph, the X-axis (or Category axis) displays the categories into which the information is divided. For instance, if you are graphing the number of computers sold per year, you would place the years on the X-axis.
In a three-dimensional graph, the Y-axis is also called the Series axis. Each category is composed of one or more series that further breaks down the information for each value of the X-axis field. Each data point in the graph is the intersection of one category and one series. In the example illustrated above, each computer model is a series.
In a two-dimensional graph, the series remain on the X-axis. The columns representing each series are distinguished by their patterns. In a three-dimensional graph, the series are displayed on their own axis. Each series still has its own pattern, but now the series are also separated from each other in space.
The Z-axis displays the values calculated for each combination of category and series. In the computer sales example, the Z-axis would contain the values for the numbers of each type of computer sold per year. For instance, if there were 725 Widget Pro computers sold in 2006, the Z-axis value corresponding to the X-axis category “2006” and the Y-axis series “Widget Pro” would be 725
You can vary the appearance of 3D graphs or vary some of their mechanisms using the options provided. To see the options available for a graph, double-click directly on it or choose Options in the Chart menu of 4D Chart.
3D Column graphs, like 2D Column graphs, compare one item to another, or one or more items over a period of time.
The following options are available for 3D Column graphs:
- Category Gap/Width: The gap between or width of the categories in the graph. The larger the category gap, the smaller the category width.
- Series Gap/Width: The gap between or width of the series in the graph. The larger the series gap, the smaller the series width.
- Tops only: Show only the top side of each column.

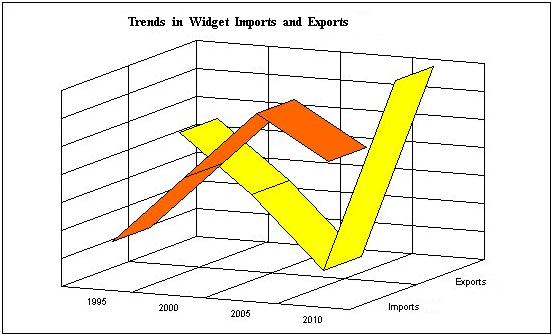
3D Line graphs show trends in your data. They should be used for continuous categories, such as time.
The following options are available for 3D Line graphs:
- Series Gap: The gap between the series in the graph. The larger the series gap, the smaller the series width.
- Series Width: The width of the series in the graph.
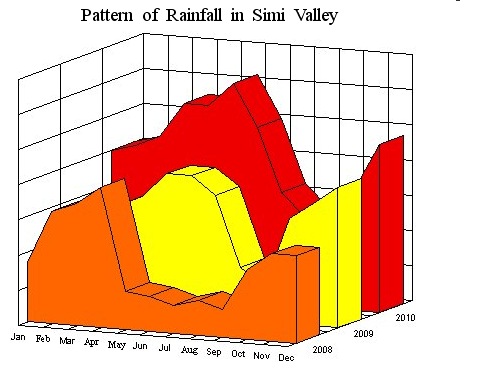
3D Area graphs emphasize the volume or size of the series over a continuous category, such as time.
The following options are available for 3D Area graphs:
- Series Gap: The gap between the series in the graph. The larger the series gap, the smaller the series width.
- Series Width: The width of the series in the graph.
Surface graphs show three-dimensional data where the Z-axis value varies depending on the X- and Y-axis values. Surface graphs are commonly used to graph the results of mathematical formulas.
The following graph was created using a mathematical formula.

The following option is available for 3D Surface graphs:
- Tops only: Show only the top side of the surface, not the sides. This option is used in the previous example graph.

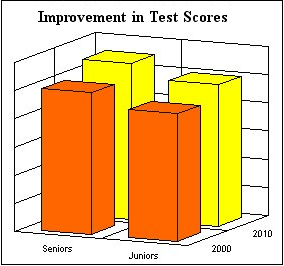
3D Triangle graphs compare one item to another, or one or more items over a period of time. 3D Triangle graphs are an alternative to 3D Column graphs.
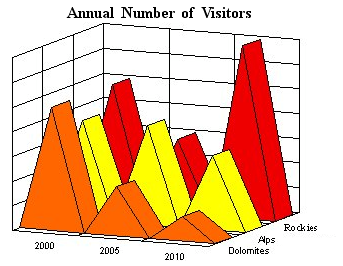
The following options are available for 3D Triangle graphs:
- Series Gap/Width: The gap between or width of the series in the graph. The larger the series gap, the smaller the series width.
- Flipped: The triangles appear flipped vertically.

- Plot Zero Values: If this option is not selected, zero values will be omitted from the graph.
3D Spike graphs show the intersection of three values. Each data point is connected to the Category plane with a drop line.
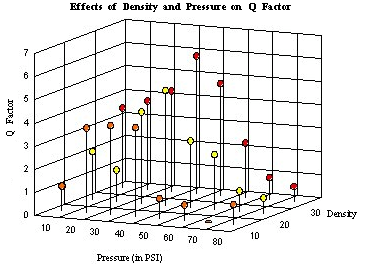
The following option is available for 3D Spike graphs:
- Oval/Square Heads: Use this option to specify whether the spike heads are oval or square.

Product: 4D
Theme: Using 4D Chart


