
4D v13
Managing graph windows
 Managing graph windows
You can use 4D Chart in its own window. When used in its own window, 4D Chart operates as if it were a separate application.
When you open 4D Chart in a plug-in window, the window has its own menu bar. 4D’s menu bar remains at the top of the screen. When you expand the window to full screen size by clicking the window’s zoom box, 4D’s menu bar remains at the top of the screen and 4D Chart’s menu bar remains within the 4D Chart window.
To generate and modify a graph in an external 4D Chart window, you have two possibilities:
- Call the Chart Wizard directly from 4D. You do this by choosing Charts... from the Tools menu of 4D or in the menu associated with the “Tools” button in the 4D tool bar.
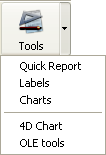
After it has been set up, the graph is displayed in a new external window. - Open a blank 4D Chart window then use the menus and functions of the plug-in to create your graph. You do this by choosing 4D Chart from the Tools menu or from the menu associated with the “Tools” button in the 4D tool bar.
You can place a 4D Chart area in any form. If you use a table form, you can save the contents of the 4D Chart area with each record. When you use 4D Chart in an input form, you can display a graph for each record in the table. You can also use a 4D Chart area in an output form.
When 4D Chart is used in a form, the 4D Chart menu bar appears at the top of the 4D Chart area. You can choose menu commands from either the 4D menu bar or the 4D Chart menu bar.
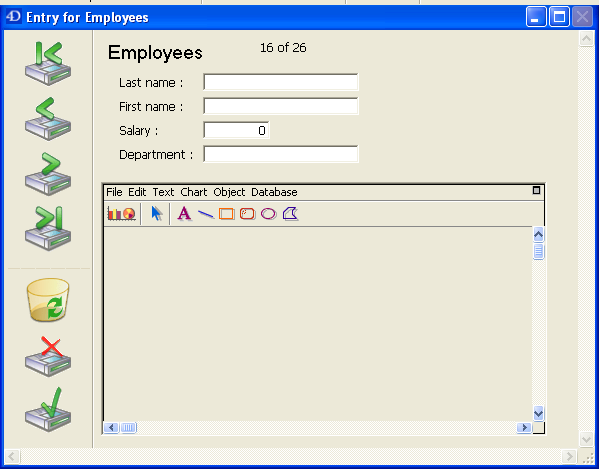
To expand a 4D Chart area, choose Go to Full Window from the 4D Chart File menu or click the 4D Chart area’s zoom box. The document expands to fill the entire screen, and 4D Chart’s menu bar temporarily replaces 4D’s menu bar. The expanded window has a size box and close box. When the document window is expanded, the Go to Full Window menu item in the File menu changes to Return to Form.
To reduce the window and return to the form, choose Return to Form from the File menu or click the close box.
You can add a chart area in an input form and save a graph with each record in the table. For more information about inserting a plug-in area into a form, refer to LISTBOX SET TABLE SOURCE.
By default, if the size of the 4D Chart area included in the form is less than the minimum size (width 300 pixels, height 150 pixels), it will appear as a button. The button title is the name of the variable associated with the plug-in area.

When the user clicks on this button, the area is displayed in full-page mode. It is possible to disable this operation using the CT SET ENTERABLE language command (the area is then never displayed as a button).
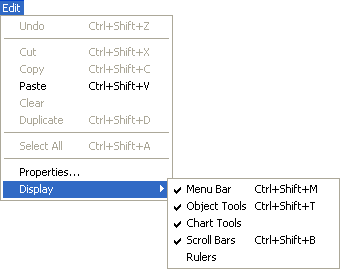
You can choose to hide or display several of 4D Chart’s features, including:
- The 4D Chart menu bar,
- The Object Tool palette,
- The Chart Tool palette,
- Scroll bars,
- Rulers.
To display or hide a 4D Chart feature:
- Choose the Display command in the Edit menu of 4D Chart.
A submenu appears containing the different functions that you can display or hide. Items that are checked in this submenu are displayed in 4D Chart . - Check or uncheck the items as desired.
Note: If you have hidden the 4D Chart menu bar, you can display it by pressing Ctrl-Shift-M on Windows or Command-Shift-M on Macintosh.
You can change the document size by changing the number of pages in the document or by specifying a new document size in points. The maximum drawing size is 3500 x 3500 points. You can add pages to the right of the first page, below it, or both.
To change the document size:
- Choose Properties from the 4D Chart Edit menu.
The following dialog box appears.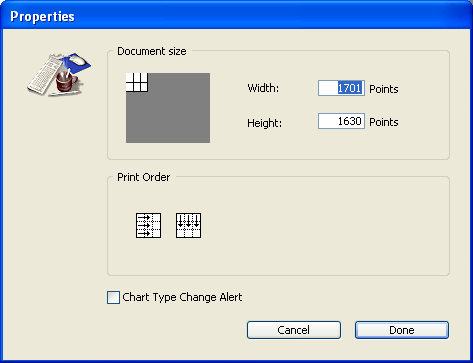
The document size is indicated by the point values to the right of the model document area and by the white rectangles in the model document area. - Click in the Document size area to adjust the number of pages in the drawing.
OR
Enter the exact size of the document (in points) in the Width and Height text areas.
Product: 4D
Theme: Using 4D Chart


