
4D v13
Building a graph
 Building a graph
4D Chart allows you to create two-dimensional and three-dimensional graphs based on the data in fields in your database. You can graph the values in the fields themselves, or you can graph the values that result from formulas that use the fields.
Whatever the case, when you create a graph, you select the data that you want to graph on each axis. For each axis, there are certain restrictions on the data types that can be graphed. If a data type cannot be graphed on a certain axis, fields of that type cannot be selected in the Chart Wizard. The following table provides information on the types of data that can be assigned to the Categories or Series axis and the Values axis.
| Data Type | Category or Series Axis? | Values Axis? | Compatible Types on Values Axis |
| Alpha | Yes | No | ------- |
| Text | Yes | No | ------- |
| Date | Yes | Yes | ------- |
| Time | Yes | No | ------- |
| Boolean | Yes | No | ------- |
| Integer | Yes | Yes | Real, Long integer |
| Long integer | Yes | Yes | Real, Integer |
| Integer 64 bits (*) | No | No | ------- |
| Real | Yes | Yes | Integer, Long integer |
| Float (*) | No | No | ------- |
| BLOB | No | No | ------- |
| Picture | No | No | ------- |
(*) The Integer 64 bits and Float types are only used by the SQL engine of 4D.
Before you begin the process of creating a graph, you must create a selection of records to graph. 4D Chart can operate in its own window or in 4D Chart areas on forms.
4D Chart graphs the records in the current selection. Before you create a graph in a plug-in window, select the records you want to graph.
4D Chart will not create a graph unless there is at least one record in the current selection of the table whose data you want to graph.
A 4D Chart area in an input form can be used to graph data in other tables.
The table whose records you want to graph must have at least one record in its current selection. If the table that contains the form is automatically related to the table you wish to graph, the current record in the input form determines the selection of records in the related table.
Because you have a record loaded in an input form, you should avoid creating graphs from data in the current table. If you want to graph data from the same table as the input form, you must use PUSH RECORD and POP RECORD or create a new process with the New process function.
For a two-dimensional graph, you specify a field for the horizontal axis (X-axis) and one or more fields or formulas for the vertical axis (referred to in 4D Chart as the Z-axis).
For a three-dimensional graph, you will specify one field (or formula) each for the X-, Y-, and Z-axes.
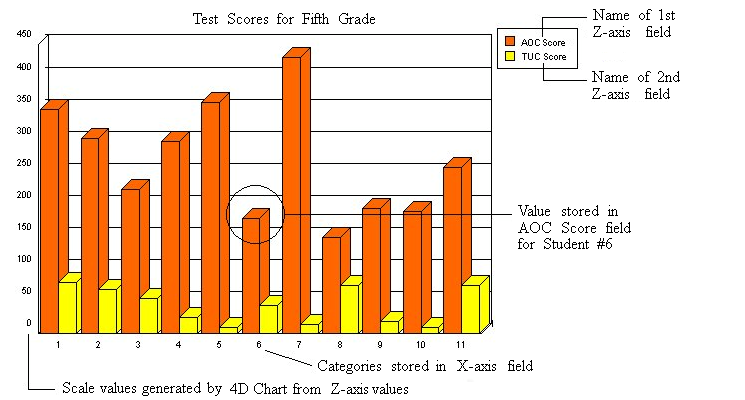
The following example graph shows how 4D Chart uses the information in the database to create a 2D graph. The graph plots the scores on two tests for each of 11 students. The X-axis field is Student ID, and the Z-axis fields are AOC Score and TUC Score.
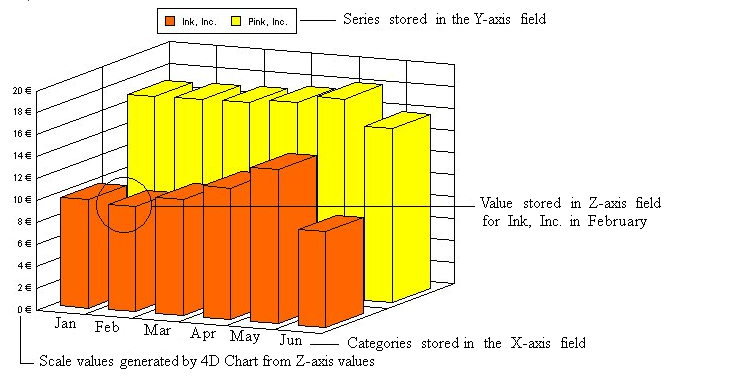
The following example graph shows how 4D Chart uses the information in the database to create a graph. The graph shows the average monthly stock value for two companies. The X-, Y-, and Z-axis fields are, respectively: Month, Company Name, and Average Price.
To create a graph from data stored in the database:
Note: Make sure that no graph is currently selected in the 4D Chart area. To deselect a selected graph, click anywhere in the 4D Chart area outside the graph.
- Choose the Charts... command in the Tools menu of 4D or click the Chart icon in the 4D toolbar.
OR
If you are in a 4D Chart area, choose New Chart from the Chart menu or click the chart creation icon in the 4D Chart tool palette.
The Chart Wizard appears: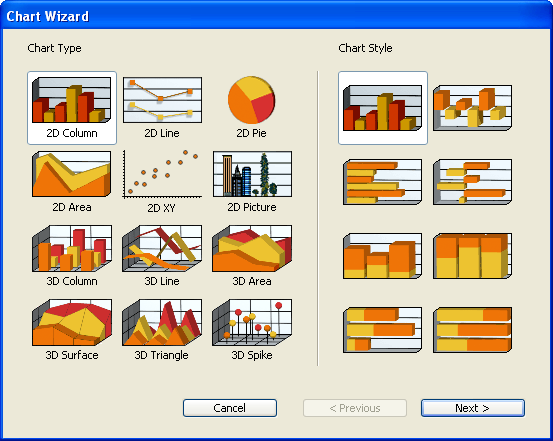
- Click a chart type. You can change it later if needed.
You can choose between 12 types of charts. Types 1-6 are two-dimensional (see Types of 2D graphs) and 7-12 are three-dimensional (see Types of 3D graphs). By default, the first chart type is selected.
When you click on a chart type, the Chart Style section and Data Selection page change to match the requirements of the selected type. - (Optional) Click on a chart style.
Note: Some chart types allow for only one style. - Click the Next > button.
The Data Selection page appears, displaying the appropriate options for the selected chart type. The names of database tables are placed in the “Source Table” drop-down list and the field names of the selected table are displayed in the “Select Fields from the Table” area.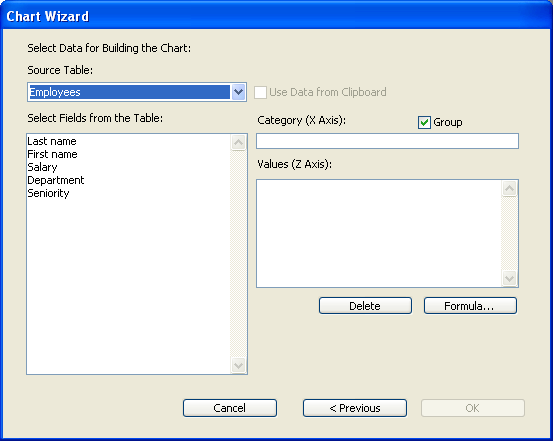
Note: If you are creating a graph in a 4D Chart area in an input form, the current table is not listed in the Tables list because you cannot graph data from the current table. - Choose the desired table from the Source Table drop-down list.
The Fields list changes to show the fields from the selected table. You must specify a field for the X-axis (Category).
Note: Integer 64 bits, Float, Picture and BLOB fields cannot be included in a graphic representation. - Drag the field that you want to assign to the Category axis to the Category box or double-click the field.
Note: If you make a mistake when choosing the X-axis field, replace the field by dragging the desired field to the Category box. - If you are creating a 3D graph, drag the Series field to the Y-axis (Second Category) box or double-click the field.
The name of the field appears in the Y-axis box.
Note: If you make a mistake when choosing the Y-axis field, replace it by dragging the correct field to the Second Category box. - Drag the field containing the values to be graphed to the Values (Z-axis) box or double-click the field.
OR
Click the Formula button (2D graphs only).
The name of the field or the formula appears in the Z-axis (Values) box.
For instructions on creating a formula, see Adding a formula.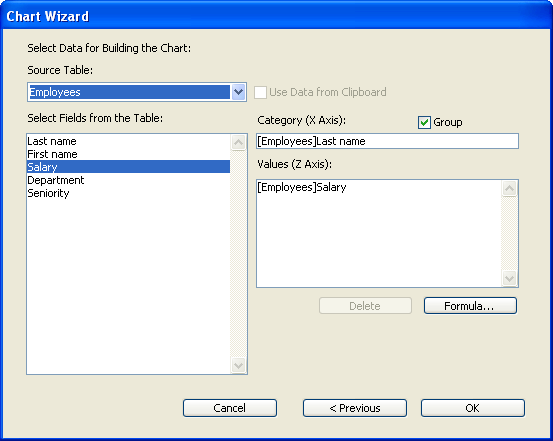
For two-dimensional graphs, you can add an unlimited number of fields and/or formulas on the Z-axis (Values). Each item placed in the Values (Z-axis) area becomes a series. For more information on series, refer to Types of 2D graphs.
Notes:- For three-dimensional graphs, to modify the field placed in the Z-axis area, you just need to drag and drop the name of another field onto the area.
- For two-dimensional graphs, you can delete a series, i.e., a field or formula placed in the Z-axis area: just select the series then click on the Delete button or press Backspace.
- If you want to have the Z-axis values summed for each X-axis category, click the Group check box.
This option is used when the X-axis categories are not unique and you want each category to appear only once, with the values for each instance summed. For more information about this option, see Grouping non-unique categories and series. - If you want to have the Z-axis values summed for each Y-axis series, click the Group check box (3D graphs only).
This option is used when the Y-axis series are not unique and you want each series to appear only once, with the values for each instance summed. For more information about this option, see Grouping non-unique categories and series. - When you have finished designing your graph, click OK.
4D Chart creates the graph and displays it in the 4D Chart area.
You can graph data from any application if it is correctly formatted and then copied to the Clipboard.
You can graph data that is formatted in the Tab-Tab-Return (TTR) format. If you copy cells from any spreadsheet application, they will be in TTR format. You can also use data from a word-processing application if it is formatted with tabs between the fields and carriage returns between the records.
Following are examples of correctly formatted data:
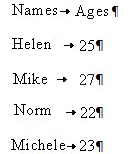
- TTR data (word-processing)
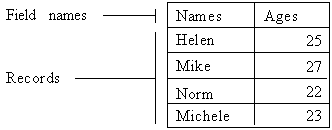
- Spreadsheet data
Names Ages Helen 25 Mike 27 Norm 22 Michele 23
The first row of data is used as the field names. Each column contains the data for one field.
Note: If you want to use dates copied to the Clipboard, the dates must be in the same format as the System-level date format.
When you have prepared the data in your application, select the desired rows and columns and copy them to the Clipboard.
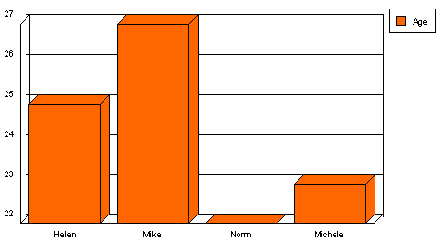
For a two-dimensional graph, you will specify a field for the X-axis and one or more fields or formulas for the Z-axis. The following illustration shows how 4D Chart interprets the information from the Clipboard.
- Clipboard
- 2D graph
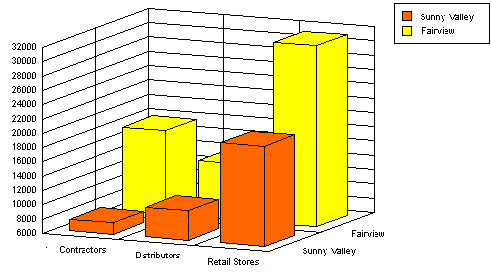
For a three-dimensional graph, you specify one field each for the X-, Y-, and Z-axes. The following illustration shows the spreadsheet data used for the example graph. The information details the total sales by two different stores to three types of customers.
- Clipboard
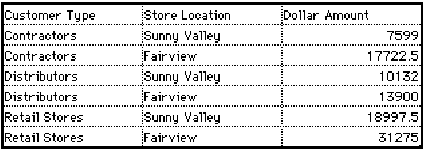
- 3D graph
To create a graph from data stored on the Clipboard:
- Follow the instructions provided in steps 1 to 3 in Creating a graph from data in the database.
- In the Data Selection page, click the Use Data From Clipboard check box.
Clicking Use Data From Clipboard disables the Source Table drop-down list and populates the Fields list with the field names from the Clipboard.
The rest of the procedure is strictly identical to the one described for creating a graph using data from your database. You have the same possibilities and options.
When you create a graph using the contents of the database, the data it contains are static. Even when the contents of the database change, the data of the graph can only be modified by an update.
To update a 4D Chart graph, choose the Update command in the Chart menu of 4D Chart.
This way 4D Chart regenerates the selected graph using the data found in the current selection of the table whose fields are being graphed.
You should update a graph in the following cases:
- To add records to the selection,
- To remove records from the selection,
- To put different records in the selection,
- When the data of the selection has been modified.
When you use the update, the graph remains the same with all the previously chosen options, but with a new selection of data.
Note: The Update menu command is only enabled for graphs created using the contents of the database.
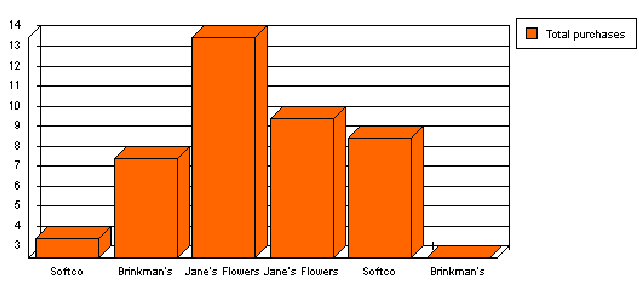
Some categories or series may appear more than once in your data. For instance, suppose that you want to graph the total purchases made by each of your customers. Each customer may have made several purchases.
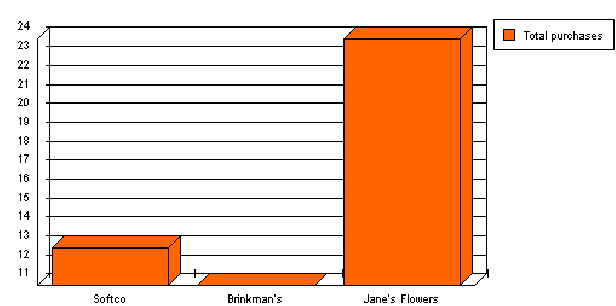
When you create a two-dimensional graph, you can choose to sum the values for non-unique categories, so that each category appears only once on the graph. When you create a three-dimensional graph, you can choose to sum the values for non-unique categories, non-unique series, or both.
To create the graph described in the example above, you might graph from the [Invoices] table, using [Invoices]Customer for the X-axis categories and [Invoices]SalesTotal for the Z-axis values.
Because some customers may have more than one invoice, you would want 4D Chart to sum the values in the [Invoices]SalesTotal field so that there would be only one value (the total) for each customer.
The illustrations below show the same basic graph with and without the Group option:
- Without group option:
- With group option:
You can graph values that are not represented in your data but are obtained by performing calculations on the data or on other values in your database. For example, you can graph your profits by graphing the results of a formula that subtracts your unit cost from your retail price.
You can refer to any function or valid 4D method “allowed” in the formula editor and graph the result on the Values axis. The method must return a value to 4D Chart. If the categories are grouped, 4D Chart sums the values returned.
If there are fields or other formulas also being graphed on the Values axis, the data types of all the values must be compatible. For instance, if you are graphing a Date field and a formula on the Values axis, the formula must return a date.
Note: Formulas are available only for two-dimensional graphs (see Types of 2D graphs).
To use a formula to calculate values for a graph:
- Open the Chart Wizard.
- When you are ready to specify the Values field in the Data Selection page, click the Formula button.
The 4D Formula dialog box appears.
For more information about the Formula editor dialog box, refer to the Formula editor chapter. - Type the formula.
Following are some examples of formulas:Formula Syntax Month of (Current date) 4D function (4D function) Day of ([Invoices]Invoice date) 4D function (field) Sin(vX) 4D function (variable) NumVisits Method that returns a value in $0 This method must have been “allowed” in the Formula editor using the SET ALLOWED METHODS command - Click OK.
- When you have finished designing the graph, click OK in the Chart Wizard to create the graph.
You can switch between chart types at any time. You can change from one two-dimensional graph type to another, or from one three-dimensional graph type to another. When creating a graph, feel free to experiment with chart types to find the best way to present your data.
To change the chart type:
- Make sure that the graph is selected.
You select a graph by clicking it. When a graph is selected, selection handles appear around it. - Click the Chart button
 in the 4D Chart Tool palette.
A pop-up menu appears, which lets you select another type of chart. This menu does not allow a preview of the chart types.
OR
Choose the Chart Type item in the Chart menu of 4D Chart.
The “Choose a Chart Type” window is then displayed. - You can select another chart type and click OK.
The graph is redrawn using the new chart type. Both the Chart drop-down list and the Choose a Chart Type window display only the chart types that are appropriate for the selection of data.
Note: You cannot plot 3D data using a 2D chart type, and vice versa.
You can have 4D Chart display an alert dialog box when the user attempts to change the type of a graph. The user then has the option to cancel or continue with the change.
- Choose Properties from the 4D Chart Edit menu.
The Properties dialog box appears: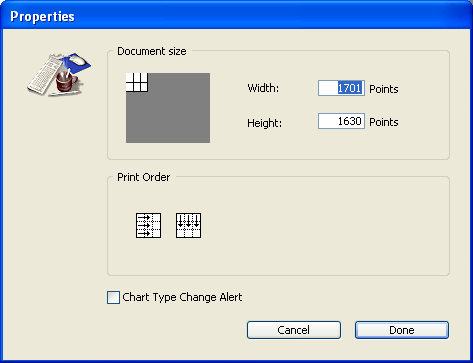
- Check the Chart Type Change Alert check box and click OK to close the Properties dialog box.
Product: 4D
Theme: Using 4D Chart


