
4D v13.4
Why a Debugger?
 Why a Debugger?
When developing and testing your methods, it is important that you find and fix the errors they may contain.
There are several types of errors you can make when using the language: typing errors, syntax or environmental errors, design or logic errors, and runtime errors.
Typing errors are detected by the Method editor and displayed in red and a message is displayed in the information area at the bottom of the method window. The following window shows a typing error:
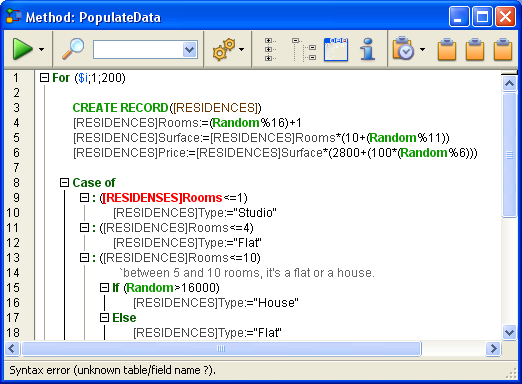
Note: The comments have been manually inserted for the purpose of this manual. Only the color is modified by 4D at the location of the error.
Such typing errors usually cause syntax errors (in this case, the name of the table is unknown). The information area displays a description of the error when you validate the line of code.
When this occurs, fix the typing error and type Enter (on the numeric pad) to validate the fix. For more information about the Method editor, refer to the 4D Design Reference.
Some errors can be caught only when you execute the method. The Syntax Error Window angezeigt. Beispiel: is displayed when an error occurs. For example:
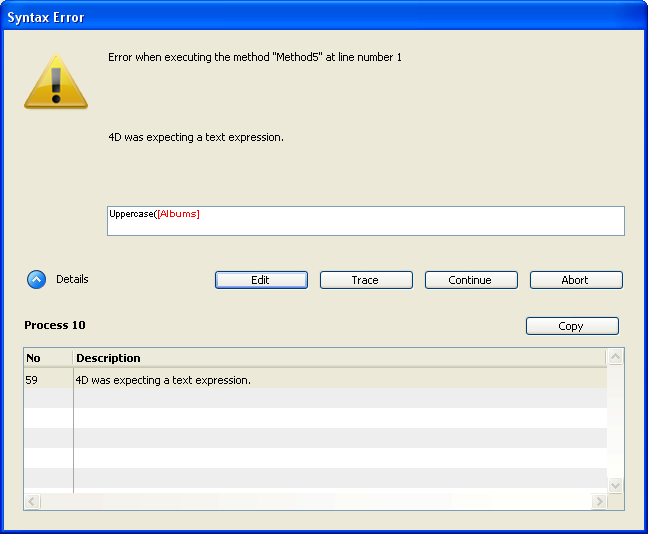
In this window, the error is that a table name is passed to the Uppercase command, which expects a text expression. To learn about this window and its button, see the section Syntax Error Window. In the above picture, the "Details" area is expanded in order to display the last error and its number.
Occasionally, there there may not be enough memory to create an array or a BLOB. When you access a document on disk, the document may not exist or may already open by another application.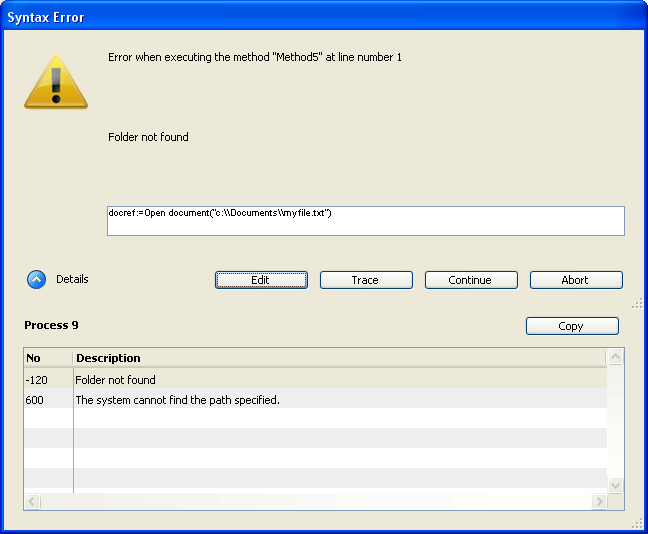
These errors do not directly occur because of your code or the way you wrote it; they occur because sometimes “bad things just happen.” Most of the time, these errors are easy to treat with an error catching method installed using the command ON ERR CALL.
For more information about this window, refer to the Syntax Error Window section.
These are generally the most difficult type of error to find—use the Debugger to detect them. Note that, other than typing errors, all the previous error types are to a certain extent covered by the expression “Design or logic error.” For example:
- A syntax error may occur because you try to use a variable that has not yet been initialized.
- An environmental error may occur because you try to open a document whose name is received by a subroutine which does not get the right value in the parameter. Note that in this example, the piece of code that actually “breaks” may be different than the code that is actually the origin of the problem.
Design or logic errors also include such situations as:
- A record is not properly updated because, while calling SAVE RECORD, you forgot to first test whether or not the record was locked.
- A method does not do exactly what you expect, because the presence of an optional parameter is not tested.
In Application mode, you can obtain errors that you never saw in interpreted mode. Here is an example:
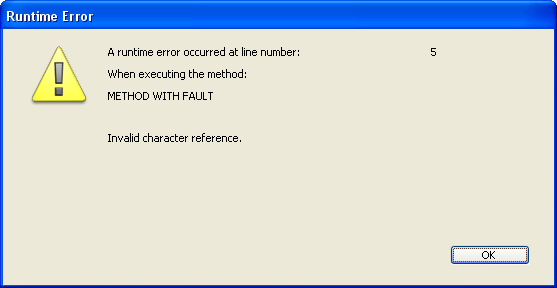
This message indicates that you are trying to access a character whose position is beyond the length of a string. To quickly find the origin of the problem, note the name of the method and the line number, reopen the interpreted version of the structure file, and go to that method at the indicated line.
Errors are common. It would be unusual to write a substantial number of lines of code (let’s say several hundred) without generating any errors. Conversely, treating and/or fixing errors is normal, too!
With its multi-tasking environment, 4D enables you to quickly edit/run methods by simply switching windows. You will discover how quickly you can fix mistakes and errors when you do not have to rerun the whole thing each time. You will also discover how quickly you can track errors if you use the Debugger.
A common beginner mistake in dealing with error detection is to click Abort in the Syntax Error Window, go back to the Method Editor, and try to figure out what's going by looking at the code. Do not do that! You will save plenty of time and energy by always using the Debugger.
- If an unexpected syntax error occurs, use the Debugger.
- If an environmental error occurs, use the Debugger.
- If any other type of error occurs, use the Debugger.
In 99% of the cases, the Debugger displays the information you need in order to understand why an error occurred. Once you have this information, you know how to fix the error.
Tip: A few hours spent in learning and experimenting with the Debugger can save days and weeks in the future when you have to track down errors.
Another reason to use the Debugger is for developing code. Sometimes you may write an algorithm that is more complex than usual. Despite all feelings of accomplishment, you are not totally sure that your coding is correct, even before trying it. Instead of running it “blind,” use the TRACE command at the beginning of your code. Then, execute it step by step to control what happens and to check whether your suspicion was correct or not. A purist may dislike this method, but somethimes pragmatism pays off more quickly. Anyway... use the Debugger.
Use the Debugger.
Product: 4D
Theme: Debugging
Break List
Catching Commands
Debugger
Debugger Shortcuts
ON ERR CALL
Syntax Error Window


