4D v13.4
Syntax Error Window
4D v13.4
Syntax Error Window
 Syntax Error Window
The Syntax Error Window is displayed when method execution is halted. Method execution can be halted for one of the following reasons:
- 4D halts execution because there is an error preventing further method execution.
- The method produces a false assertion (see the ASSERT command).
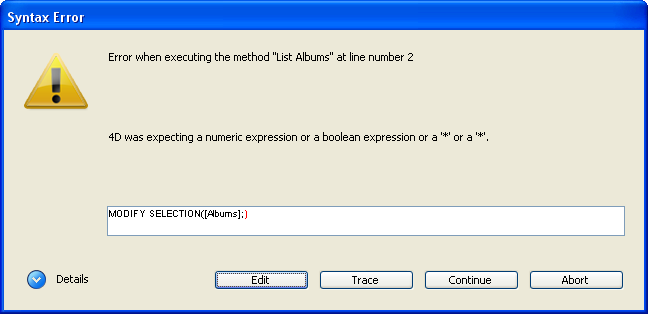
The Syntax Error Window is shown here:

The upper text area of the Syntax Error Window displays a message describing the error. The lower text area shows the line that was executing when the error occurred; the area where the error occurred is highlighted.
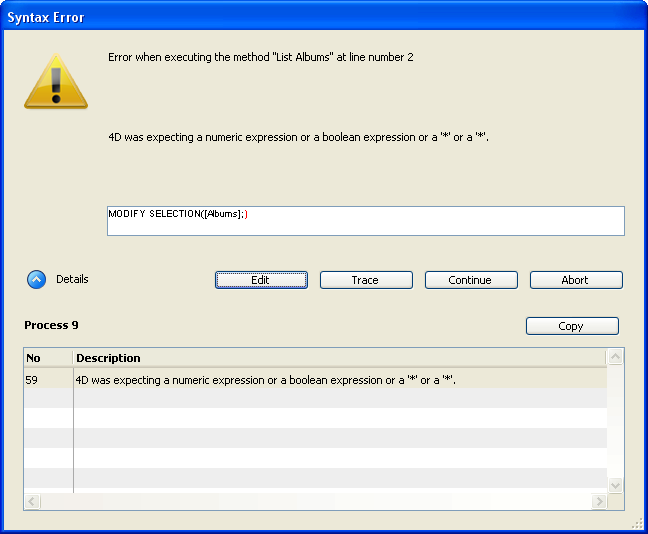
The Details button can be used to expand the lower part of the window displaying the "stack" of errors related to the process:

There are five option buttons at the bottom of the window: Abort, Trace, Continue, Edit and (if the window is expanded) Copy.
- Abort: The method is halted, and you return to where you were before you started executing the method. If a form or object method is executing in response to an event, it is stopped and you return to the form. If the method is executing from within the Application environment, you return to this environment.
- Trace: You enter Trace/Debugger mode, and the Debugger window is displayed. If the current line has been partially executed, you may have to click the Trace button several times. Once the line finishes, you end up in the Debugger window.
- Continue: Execution continues. The line with the error may be partially executed, depending on where the error was. Continue with caution—the error may prevent the remainder of your method from executing properly. Usually, you do not want to continue. You can click Continue if the error is in a trivial call, such as SET WINDOW TITLE, which does not prevent executing and testing the rest of your code. You can thus concentrate on more important code, and fix a minor error later.
Note: Holding down the Alt (Windows) or Option (Mac OS) key when you click on the Continue button means that the window will not be displayed if the same error, triggered by the same method at the same line, occurs again. This shortcut is useful in the case of an error that occurs repeatedly, for example in a loop. In this case, everything continues as if the user was clicking on the Continue button each time. - Edit: All method execution is halted. 4D switches to the Design environment. The method in which the error occurred is opened in the Method editor, allowing you to correct the error. Use this option when you immediately recognize the mistake and can fix it without further investigation.
- Copy: This button copies the debugging information into the clipboard. This information describes the internal environment of the error (number, internal component, etc.). It is formatted as tabbed text. Once you have clicked this button, you can paste the contents of the clipboard into a text file, a spreadsheet, an e-mail, etc. for analysis purposes.
PROPERTIES
Product: 4D
Theme: Debugging
SEE ALSO
Debugger
ON ERR CALL
Why a Debugger?


