
4D v13.4
Method editor
 Method editor
By default, a window of the Method editor consists of several areas: a toolbar, an editing area, a lists area, a status bar and a break points area.
You can customize the method editing area, for example by adding lists or hiding lines numbers.
Each Method editor window contains a toolbar that provides instant access to basic functions related to method execution and editing.
Method execution | This button causes the execution of the method. Using the menu associated with the button, you can select the type of execution. Only project and database methods can be run using this button. For more information about these commands, refer to Executing methods. |
Search | Clicking on the search icon causes the display of the standard search dialog box, which allows performing a search in the current method. The associated combo-box can be used to launch a standard search directly: to do this, enter the character string you want to search for and press Enter or the Carriage return. The combo-box also lists the last searches carried out; to redo a search, select it from the combo-box menu. For more information, refer to Find and replace in methods. |
Macros  | This button displays a menu listing all available macro-commands. For more information, refer to Creating and using macros. |
Expand all / Collapse all | These buttons allow expanding or collapsing all the control flow structures of the method. For more information, refer to "Expand / Collapse" in Writing a method. |
Show or hide lists | This button allows displaying or hiding the lists in the window. For more information, refer to the "Lists area" section. |
Method information | This button causes the display of the Method Properties dialog box (project methods only). For more information, refer to Project method properties. |
Last Clipboard values | This button displays a menu listing the last 20 items copied in the window. If you select an item, it is recopied at the spot where the cursor is located. |
Clipboard  | These 9 icons represent the 9 clipboards available in the Method editor. A white icon containing a number indicates that a clipboard contains data; an orange icon indicates an empty clipboard. You can use these clipboards by clicking on them directly or by using keyboard shortcuts. For more information, refer to Writing a method. |
Lock(4D Server only)  | This icon indicates that the method is locked by another user. Clicking the padlock allows reloading the method (and thus displaying any changes made by the other user). |
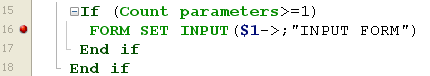
The editing area contains the text of the method. You enter and modify the method text in this area. The editor automatically indents method text and colors the different syntax elements for clear method structure.
You can customize the display of this area. Any customization is automatically passed on to all the windows of the editor.
- font and font size: you set the character font and size to be used in the editing area on the Methods Page of the 4D Preferences. You can also change the font size using the Method > View submenu: the Bigger Font and Smaller Font commands let you vary the font size in one-point steps.
- style and color of syntax elements: You can assign a specific color and/or style to each type of element of the 4D or SQL language. To do so, right-click on a language element (variable, keyword, etc.) and choose an option from the Style submenu. The modification is applied to all the elements of the same type in the current window as well as any other editor windows. You can also set these options on the Methods Page of the 4D Preferences.
- spaces: You can display the spaces between words using dots (.) instead of "blank space". To do this, choose the View > White Spaces command of the Method menu (a check mark indicates whether spaces are displayed). This function applies to all the code elements (command names, variables, comments, etc.)


- width of code endentations: You can set this option on the Methods Page of the 4D Preferences.
- interface colors: You can change the different colors used in the interface of the editing area (highlighting, background, and so on) using the options found on the Methods Page of the 4D Preferences.
For more information about entering code in this area, refer to Writing a method.
The lists area lets you display one or more lists of elements necessary for writing methods (commands, constants, forms, etc.). You can choose the number and contents of the lists displayed in the window.
By default, the Method editor displays four lists. You can enlarge or reduce the relative width of each list area by dragging one of its partitions. It is also possible to adjust the size of the list area in relation to that of the editing area by dragging the dividing line between them.
- Double-clicking on an item in a list causes it to be inserted into the editing area, at the location of the cursor.
- To modify the contents of a list, click on the title area of the list concerned: a pop-up menu appears, enabling you to choose the type of item to be displayed.
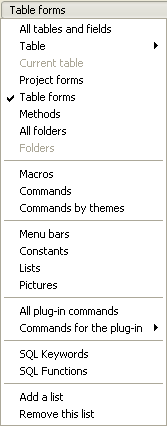
- For adding or removing a list, click in the title area of one of the lists and choose the corresponding command in the pop-up menu (see below).
Note that at least one list must be displayed in the editor window. The Remove this list command is disabled when you click on the last list. If you want to hide all the lists, you must either click on the button or hide them by default in the User preferences (see below). - You can hide the lists in all the windows by deselecting the View>Lists option in the Method menu (a check mark indicates whether lists are displayed) or by unchecking the Show Lists option on the Options tab of the Methods Page in the 4D Preferences. Any open methods must first be closed then reopened for the modifications made in the Preferences dialog box to be taken into account.
You can save the parameters set in the Method editor window in the form of a template. For more information, refer to Save as template.
You can display the following lists of items in the lists area of the Method editor window:
- All tables and fields: Database table and field names in the form of a hierarchical list. When you insert a field name into the method by double-clicking on its name, 4D inserts it while respecting the syntax and adds the name of the table or subtable as the case may be.
- Table (submenu): Field names of the table selected using the submenu.
- Current table: Field names of the current table (available in triggers, form methods and object methods).
- Project forms: Database project form names. When you double-click on a project form name, 4D inserts its while respecting the syntax: the form name is inserted between quotes.
- Table forms: Database table and form names in the form of a hierarchical list. When you insert a form name into a method by double-clicking its name, 4D inserts it while respecting the syntax: the form name is inserted between quotes and is preceded by the name of the table and a semi-colon. For example: [Table];"Form".
- Methods: Database project method names.
- All folders: Names of object folders and subfolders set in the database displayed in the form of a hierarchical list. Folders can be used to organize objects in a customized manner. They are managed from the Home Page of the Explorer.
- Folders (submenu): Contents of the folder selected using the submenu.
- Macros: Macro names defined for the database (see Creating and using macros).
- Commands: 4D language commands in alphabetical order.
- Commands by themes: 4D language commands classified by theme in the form of a hierarchical list.
- Menu bars: Names and numbers of menu bars created with the 4D Menu bar editor (see the Menus and menu bars chapter).
- Constants: 4D constants and those of any plug-ins, classified by theme in the form of a hierarchical list.
- Lists: Names of lists.
- Pictures: Names and numbers of pictures stored in the 4D Picture library.
- All plug-in commands: Commands for all the plug-ins installed in the database, classified by theme in the form of a hierarchical list.
- Commands for the plug-in (submenu): Commands of a specific plug-in selected using the submenu. By default, the following plug-ins are available:
- 4D Internet Commands: This plug-in adds additional Internet functions to 4D, in particular for the management of e-mail. See 4D Internet Commands.
- 4D Chart: 4D Chart is a chart editor built into 4D. See 4D Chart Language.
- OLE_Tools (Windows only): OLE_Tools, supplied with the Windows version of 4D, is a plug-in for the management of OLE areas. See OLE Tools.
- SQL Keywords: set of keywords recognized by the 4D SQL syntax parser. This list includes commands (e.g. SELECT), clauses (e.g. WHERE) as well as functions (ABS).
- SQL Functions: 4D SQL functions.
Note: Except for the Macros element, all the lists are in alphabetical order.
This area, located to the left of the editing area, allows you to display the line numbers and to insert break points directly next to specific instructions. Break points are useful during the debugging phase of your programming. They stop the execution of your code at specific locations and display the debugger.
To insert a break point, click in the break points area at the location you want it to be placed or choose the Toggle Breakpoint command from the context menu of the editor. A red dot indicates the presence of a break point.
You can display the location of all the break points present in the database in the Runtime Explorer.
To delete a break point, click the red dot or choose the Toggle Breakpoint command in the context menu again.
To temporarily disable a break point or modify its properties, press the Alt key (Windows) or the Option key (Mac OS) while clicking on the break point or choose the Edit Breakpoint... command in the context menu of the editor. When you click the break point, the break point property window is displayed. For a complete description of break points, refer to Break Points in the 4D Language Reference manual.
You can display or hide the line numbers in the break points area for each window of the Method editor.
- The display of line numbers can be enabled or disabled by default using the Show Line Numbers option on the Methods Pageof the 4D Preferences.
- It is also possible to modify this display separately for each window of the Method editor, using the View> Line Numbers command in the Method menu.
Displaying the line numbers makes it easier to find your way around in the window. The Go to Line Number... command in the Method menu also lets you take advantage of this display (see the "Goto Line..." section of Find and replace in methods).
The status bar located at the bottom right part of the editor window displays the position of the cursor at all times:
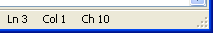
- Ln: Line number
- Col: Column number, i.e., the level in the hierarchy of programming structures. The first level is 0. The column number is useful for debugging since this information can be provided by the interpreter in the event of an error in the code.
- Ch: Location of character in the line.
You can save the parameters set in the Method editor window in the form of a “template.” Once the template is saved, the parameters set in it will be used for each new Method editor window that is opened.
The following parameters are stored in the template:
- Relative size of the editing and list areas
- Number of lists
- Location and contents of each list
- Relative width of each list
To save a Method editor window as a template, choose the Save As Template command in the Method menu. The template is saved immediately (no dialog box appears). It is stored in the Preferences of the 4D application. If a previous template already exists, it is replaced.
Product: 4D
Theme: Editing methods


