4D v13.4
Adding calculations
 Adding calculations
You can add a formula to a column in a quick report. For example, you can add a formula that computes employees’ monthly salaries from an Annual Salary field.
To associate a formula with a column:
- Add or insert an empty column.
OR
Click an existing column and choose Edit... from the Columns menu.
OR
Double-click an existing column’s header.
OR
Right-click on an existing column header to display the Quick Report context menu and choose Edit...
4D displays the Formula editor, which you can use to build a formula. If you selected an existing column, the formula you create replaces the previous contents of the column.
Note: Make sure that the formula you create does not change the current selection. Changing the current selection will cause problems when you print the quick report since the report is based on the current selection. For information about commands and functions that change the current selection, refer to the 4D Language Reference manual. - Build the formula by selecting the fields, operators, commands and/or 4D methods, then enter the desired values in the editing area.
OR
Click the Load... button to retrieve an existing formula from disk.
For more information about the formula editor, refer to the Formula editor chapter.
To save the formula as a file that you can retrieve and use in another column or in another report, click the Save... button and enter a filename in the dialog box. - Click OK to assign the formula to the column.
4D adds a new label to the column that identifies it as a formula. You can relabel the column by typing a label into the header cell for that column. The formulas are labelled C1 to Cn. These labels are the name of the variables containing the current value of the column. You can use these variables in other formulas.
You can add summary calculations on the contents of fields and formulas to each Subtotal row and to the Totals row. In a cross-table report, calculations can be inserted in the center row.
The calculation buttons in the toolbars of the Quick Report editor identify the summary calculation options available for quick reports:

These buttons correspond to the following calculations:
- Sum: Totals the values in the report or break.
- Average: Calculates the average of the values in the report or break.
- Minimum: Displays the lowest value in the report or break.
- Maximum: Displays the highest value in the report or break.
- Count: Calculates the number of records in the report or break.
- Standard deviation: Displays the square root of the variance of the report or break (the variance is a dispersion value around the average).
These options also appear in the Quick Report context menu for cells in the Subtotal and Total rows or, for a cross-table report, in the total cells and the center cell.
- List Reports
When you place a summary calculation in the Totals row, the calculation is done for all records in the report. If you place the summary calculation in a subtotal row, separate calculations are done for the records in each break.
- Cross-table reports
Summary calculations will apply as follows:
1 = Applies to each cell of the table
2 = Applies to values in each row
3 = Applies to values in each column
4 = Applies to values in both the last column and last row
To add a summary calculation:
- Select a cell where you want to insert the summary calculation.
The Sum, Minimum, Maximum, and Average calculations work only on a numeric field or formula. - Click as many summary calculation buttons as you like.
OR
From the context menu, choose the desired summary calculations.
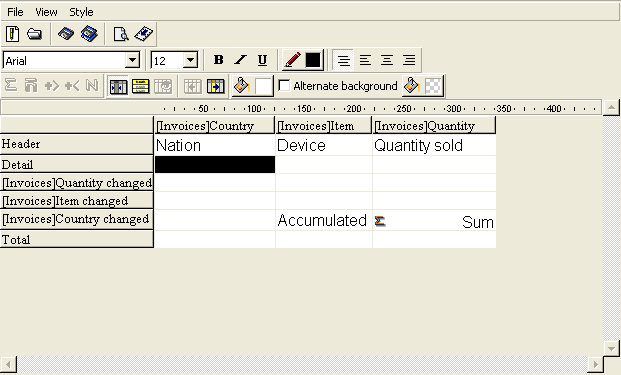
4D displays a calculation icon in the selected cell for each type of summary calculation you request. The following figure shows a Sum calculation icon in a Subtotal row:
You can insert summary calculations using the following codes:
- ##S will be replaced by the sum in the sub-total or total row.
- ##A will be replaced by the average.
- ##C will be replaced by the count.
- ##X will be replaced by the max.
- ##N will be replaced by the min.
- ##D will be replaced by the standard deviation.
- ##xx, where xx is a column number. This will be replaced by that column’s value, using its formatting. If this column does not exist, then it will not be replaced.
These codes can be useful when you want to mix labels and data in a cell.
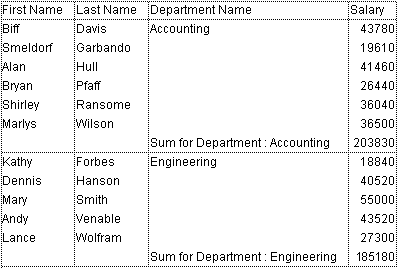
In a report with subtotals, the columns which are used to group records so that summary calculations can be done are called Break columns. In the report shown below, the Department field is a Break column since the records in the report are grouped by department.
When a report like this is printed, the values for the Break column are printed only once per break.
In other words, a department name is printed only for the first record in the group and is not repeated until the department changes.

In some cases, you may want to repeat the values for the Break columns so that they appear for every record in the Break area. You do so by selecting the Repeated Values column property. This can be done either by clicking the Repeated Values button in the toolbars, by choosing the Repeated Values menu command in the Quick Reports context menu for that column, or by selecting Repeated Values from the Columns menu.
To display repeated values for fields in a column:
- Select the column by clicking the header row for that column and choosing the Repeated Values command in the Columns menu or clicking the Repeated Values button
 in the “Columns” toolbar.
OR
From the context menu for that column, choose Repeated Values.
In this menu, a check mark next to a command means that the property is assigned to the column. When the report is printed, break column values are repeated for each record.
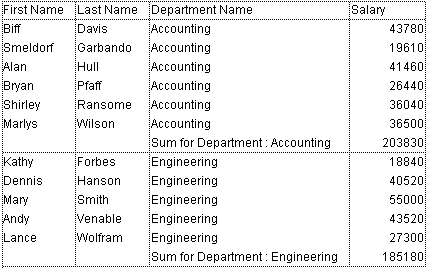
The following figure shows the previous report after the Repeated Values check box has been checked for the Department Name column:

Product: 4D
Theme: Quick reports


