4D v13
Processes Page
 Processes Page
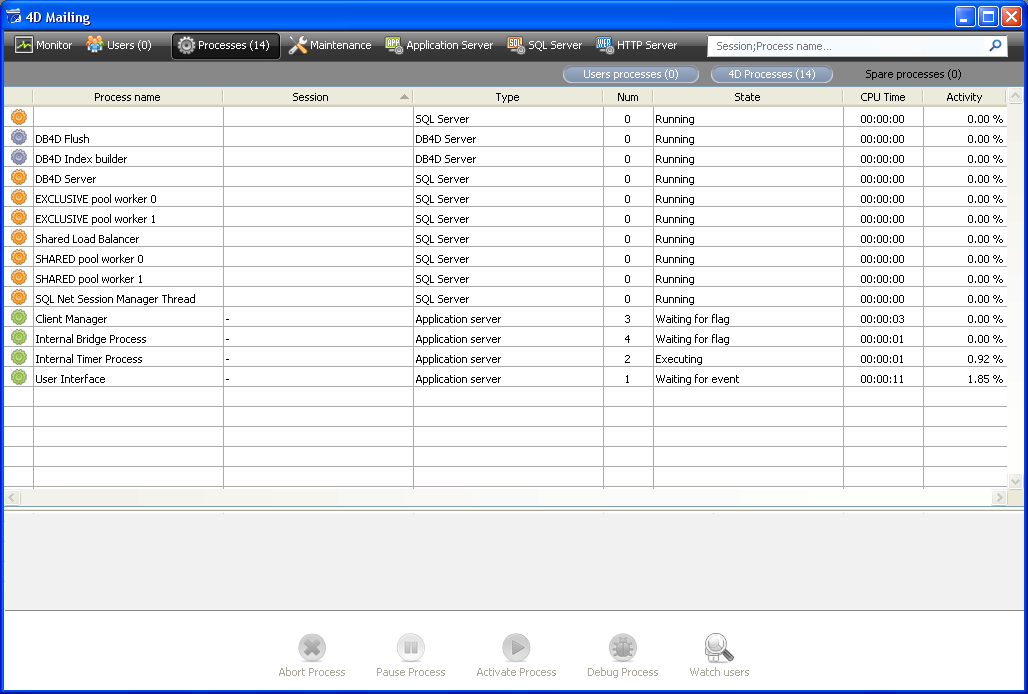
The Processes Page lists all the processes underway:

The "Processes" button indicates, in parentheses, the total number of processes running in the database (this number does not take into account any display filters applied to the window nor the state of the Display processes by groups option).

You can change the order of the columns by simply dragging and dropping the column header areas. You can also sort the list of column values by clicking on its header.
Like the Users Page, this page contains a dynamic search/filtering area that can be used to reduce the number of rows displayed in the list to those that correspond to the text entered in the search area. The search/filtering is carried out in the Session and Process name columns.

There are also three shortcut buttons that can be used to filter by the type of process displayed in the window:

- Users processes: Processes generated by and for the user sessions. These processes are preceded by an icon in the form of a figure.
- 4D Processes: Processes generated by the 4D Server engine. These processes are preceded by an icon in the form of a notched wheel.
- Spare processes: Processes that are inactive but kept temporarily and that can be reused at any time. This mechanism optimizes the reactivity of 4D Server. These processes are preceded by an icon in the form of a dimmed figure.
The Display processes by groups option lets you group together the internal processes of 4D Server as well as the client processes, for better readability. When you check this option:
- the "twinned" 4D client processes (main 4D client process and 4D client base process, see the “Process Type” paragraph) are grouped as one,
- a "Task managers" group is created; it includes the internal processes dedicated to dividing up tasks (Shared balancer, Net session manager, Exclusive pool worker),
- a "Client managers" group is created; it includes various client internal processes.
The lower area of the window is used to display the graphic representation of the activity of the selected process(es):

Note: You can select several rows by holding down the Shift key for an adjacent selection or Ctrl (Windows) / Command (Mac OS) for a non-adjacent selection.
The activity of the process is the percentage of time that 4D Server has devoted to this process (ratio).
As in previous versions of 4D Server, the window provides the following information for each process:
- Type of process (see below),
- Session (blank in the case of a 4D process and with the 4D user name in the case of a user process),
- Name of the process,
- Number of the process (as returned by the New process function for example). The process number is the number assigned on the server. In the case of a global process, this number may be different from that assigned on the client machine.
- Current state of the process,
- Running time (in seconds) of the process since its creation,
- Percentage of time that 4D Server has devoted to this process (ratio).
Each process is identified by an icon as well as a type. The color and form of the icon indicates the type of process:
 | Application server |
 | SQL Server |
 | DB4D Server (database engine) |
 | Web Server |
 | SOAP Server |
 | Protected 4D client process (development process of a connected 4D) |
 | Main 4D client process (main process of a connected 4D). Collaborative process, equivalent on the server of the process created on the client machine) |
 | 4D client base process (process parallel to a 4D client process. Preemptive process responsible for controlling the corresponding main 4D client process) |
 | Spare process (former or future "4D client database process") |
 | 4D client process (process running on the connected 4D) |
 | Stored procedure (process launched by a connected 4D and run-ning on the server) |
 | Web method (launched by a 4DACTION for example) |
 | SOAP method (launched by a Web Service) |
 | SQL method (launched by an SQL query) |
Note: Each main 4D client process and its "twinned" 4D client base process are grouped together when the Display processes by groups option is checked.
The page also has five control buttons that act on the selected process(es). Note that only user processes can be acted upon.
- Abort Process: can be used to abort the selected process(es). When you click on this button, a warning dialog box appears so that you can confirm or cancel the operation.
Note: You can also abort the selected process(es) directly without displaying the confirmation dialog box by holding down the Alt (Windows) or Option (Mac OS) button while clicking on this button. - Pause Process: can be used to pause the selected process(es).
- Activate Process: can be used to reactivate the selected process(es). The processes must have been paused previously (using the button above or by programming); otherwise, this button has no effect.
- Debug Process: can be used to open on the server machine one or more debugger windows for the selected process(es). When you click on this button, a warning dialog box appears so that you can confirm or cancel the operation.
Note that the debugger window is only displayed when the 4D code is actually executed on the server machine (for example within the framework of a trigger or the execution of a method having the "Execute on Server" attribute).
Note: You can also debug a process directly without displaying the confirmation dialog box by holding down the Alt (Windows) or Option (Mac OS) key while clicking on this button. - Watch users: is used to display, on the Users page, all the processes of the selected user(s). This button is active when at least one user process is selected.
Product: 4D
Theme: 4D Server Administration Window


