4D v13.4
Watch page
 Watch page
The Watch page is a debugger and displays information about code execution concerning the application and the selected process.
The areas at the bottom of the window configure all the information displayed:
- Selected Process: This drop-down list contains all the processes that are being executed in the database. It allows you to select the process(es) that you want to observe.
- Update Time: In this area, you can set a value (in seconds) that indicates how often the information on the page will be updated.
The “Expression” column displays the names of the objects and expressions. The “Value” column displays the current value of the objects and expressions. These columns can be resized, one in relation to the other. By clicking on a value in the right column, you can modify the object’s value, if the object allows this.
The multi-level hierarchical list is organized by theme. The themes are the following:
- Variables: Allows you to view the list of the database’s interprocess variables as well as the list of the selected process’s process variables.
- Constants: Allows you to view the list of constants defined in the database.
- Tables and Fields, Semaphores, Sets, Processes and Named Selections: The information provided in these themes is identical to the information provided by 4D’s debugger. For more information, refer to the Watch Pane section in the 4D Language Reference manual.
- Information: This theme displays general information concerning database operation, such as the current default table (if one exists), physical, virtual, free and used memory space, query destination, etc This information allows to examine database functioning.
- Web: Displays information concerning the Web server of the application (only available if the Web server is active).
- Web File To Send: name of Web file waiting to be sent (if any)
- Web Cache Usage: number of pages present in Web cache as well as its use percentage,
- Web Server Elapsed Time: duration of Web server use in hours:minutes:seconds format
- Web Hits Count: total number of HTTP requests received since Web server launch, as well as the instantaneous number of requests per second
- Number of active Web processes: number of active Web processes, all Web processes together.
To delete an expression or a theme, select the corresponding line and press the Delete or Backspace key.
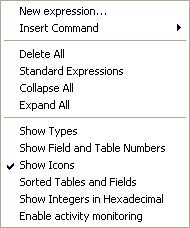
You can also perform several operations using the context menu:

You can add a New Expression or a 4D Command, or perform global actions: Delete All, display all the Standard Expressions, Collapse All or Expand All.
Note: You can add a new expression by double-clicking in the Expression column.
In addition, several display options are available in the lower part of the context menu:
- Show Types: Displays or hides the types of fields next to their names in the list of tables & fields.
- Show Field and Table Numbers: Displays or hides the table and field numbers next to their names in the list of tables & fields. For each field, the following format is applied: [TableNum]FieldNum.
- Show Icons: Displays or hides the object icons in the hierarchical list.
- Sorted Tables and Fields: Sorts the list of tables and fields by alphabetical order (by default, these objects appear in the order that they were created).
- Show Integers in Hexadecimal: Displays the variables declared as Integer or Long Integer types in their hexadecimal form.
- Enable activity monitoring: Displays additional information concerning the scheduler and the communications network. This low-level information, grouped in the Scheduler and Network items, allows advanced monitoring of the internal activity of the application. Be careful, activating this option slows down processing.
Product: 4D
Theme: Runtime Explorer


