
4D v13.4
GRAPH TABLE
- 4D Language Reference
-
- Graphs
-
- GRAPH SETTINGS
- GRAPH TABLE
- GRAPHUpd
 GRAPH TABLE
| GRAPH TABLE {( aTable )} | ||||||||
| Parameter | Type | Description | ||||||
| aTable | Table |

|
Table to graph, or Default table, if omitted | |||||
| GRAPH TABLE ( {aTable ;} graphType ; x field ; y field {; y field2 ; ... ; y fieldN} ) | ||||||||
| Parameter | Type | Description | ||||||
| aTable | Table |
|
Table to graph, or Default table, if omitted | |||||
| graphType | Longint |
|
Graph type number | |||||
| x field | Field |
|
Labels for the x-axis | |||||
| y field | Field |
|
Fields to graph (up to eight allowed) | |||||
Compatibility note: Beginning with 4D v13, the 4D Chart plug-in is no longer integrated in 4D and must be installed specifically if you want to use it. For compatibility, the GRAPH TABLE command functions if this plug-in is present, but otherwise, it does nothing. We no longer recommend using this command.
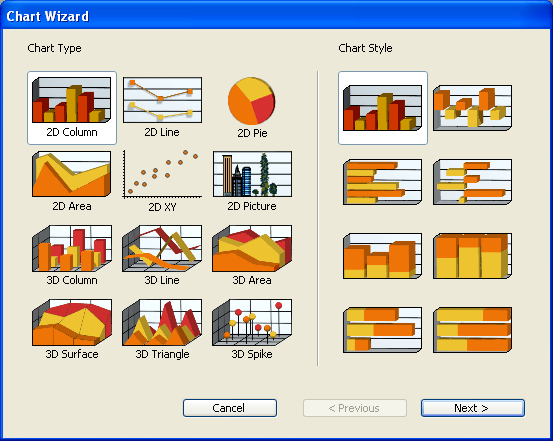
GRAPH TABLE has two forms. The first form displays the Chart Wizard of 4D Chart and allows the user to select the fields to be graphed. The second form specifies the fields to be graphed and does not display the Chart Wizard.
GRAPH TABLE graphs data from a table’s fields. Only data from the current selection of the current process is graphed.
Using the first form is equivalent to choosing Charts from the Tools menu in the Design environment. The following figure shows the Chart Wizard, which allows the user to define the graph.
The second form of the command graphs the fields specified for aTable.
The graphType parameter defines the type of graph that will be drawn. It must be a number from 1 to 8. See the 4D Chart graph types listed in the example for the GRAPH command.
Note: The GRAPH TABLE command does not allow the use of the 4D SVG rendering engine.
The x field defines the labels that will be used to label the x-axis (the bottom of the graph). The field type can be Alpha, Integer, Long integer, Real or Date.
The y field is the data to graph. The field type must be Integer, Long integer or Real. Up to eight y field fields can be graphed, each set off by a semicolon.
In either form, GRAPH TABLE opens a Chart window for working with the newly created graph. For more information about using the Chart window, see the 4D Design Reference manual.
Note: You can also use the Quick Report editor to generate graphs from field data, by using the Print Destination menu.
The following example illustrates the use of the first form of GRAPH TABLE. It presents the Chart Wizard window and allows users to select the fields to graph. The code queries records in the [People] table, sorts them, and then displays the Chart Wizard:
 QUERY([People])

 If(OK=1)

    ORDER BY([People])

    If(OK=1)

       GRAPH TABLE([People])

    End if

End ifThe following example illustrates the use of the second form of GRAPH TABLE. It first queries and orders records from the [People] table. It then graphs the salaries of the people:
 QUERY([People];[People]Title="Manager")

 ORDER BY([People];[People]Salary;>)

 GRAPH TABLE([People];1;[People]Last Name;[People]Salary)
Product: 4D
Theme: Graphs
Number:
148


Modified: 4D v6
Modified: 4D v13


